Network topology
Read the Cushy network topology map: VPCs and VNets, subnets, links between segments, the Terraform-managed (TF) vs unmanaged (UM) marker on every node, and the colour-plus-glyph status scale that is safe for colour-blind operators.
The Network screen (/network) draws your cross-cloud network as a topology map — the one signature visual of the console — with everything else kept quiet around it.
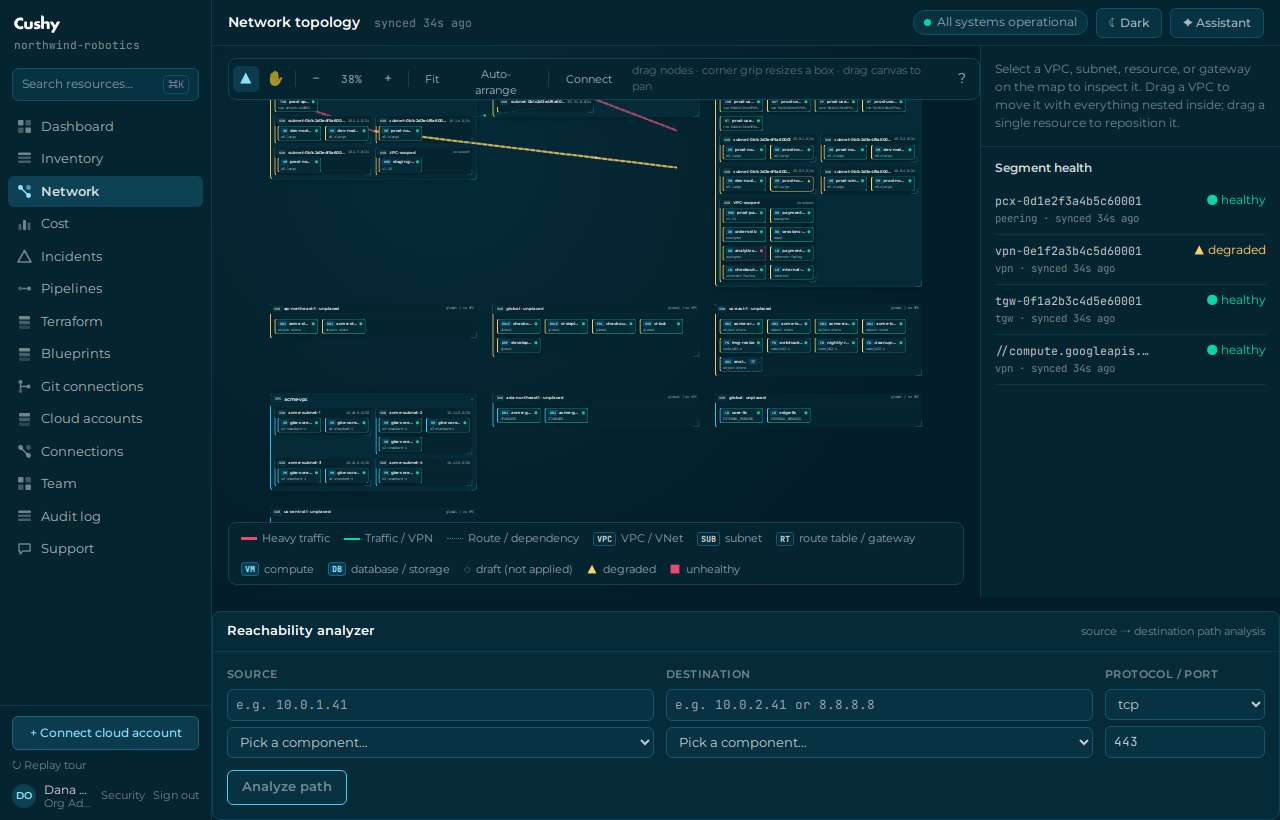
What the map shows
- Segments — your VPCs and VNets, grouped by region, each with its CIDR, subnet and instance counts.
- Plumbing nodes — the full network dependency graph: internet gateways (IGW), NAT gateways (NAT), VPC endpoints (EP), route tables (RT) and transit-gateway attachments (TGW), drawn beside their VPC with a distinct badge.
- Dependency edges — how everything connects: a route table's association lines to its subnets (explicit associations, plus a *main* route table's implicit coverage of every subnet with no explicit association — those edges say "implicit (main route table)" on hover), a route table's route to a gateway/NAT/endpoint/peering target (the *routable* plumbing), and gateway/endpoint/attachment bindings to their VPC.
- Traffic edges — when traffic data exists, directional edges are weighted by volume (thicker + warmer = more bytes) so hot paths stand out from idle ones; a legend explains the scale.
- Links — peering and VPN connections between segments; live flow animation marks active links.
- Hover for details — hovering any node shows its real facts (type, native id, CIDR, AZ, a route table's route entries and its associated-subnet count incl. implicit coverage, an endpoint's service name, a gateway's state) and any traffic bytes/packets; hovering an edge shows what it carries.
- Resizable boxes — every container box (a VPC/VNet, a subnet, the unplaced tray) has a bottom-right corner grip: drag it (mouse or touch) to resize the box. The minimum is whatever is inside it — children are never clipped. Resize is a view-only adjustment: like drag positions it is not persisted, and Auto-arrange resets it.
- Managed vs unmanaged — every node carries a management marker: TF (Terraform-managed) or UM (unmanaged, discovered only). See below.
- Status — every segment, node and link carries the shared status scale (see below).
Terraform-managed (TF) vs unmanaged (UM)
Every node on the map states its management state explicitly — there is no "no badge means unmanaged" guessing. A container header (VPC/VNet, subnet, tray) carries the mark beside its name; a resource or plumbing chip carries it at the right end of its detail line, so the node name keeps its full width.
| Mark | Meaning | What you can do |
|---|---|---|
| TF — a filled, accented rectangle | Under Terraform management: a Terraform folder (workspace) owns it and its configuration lives in generated HCL. | Click the node to edit its settings through plan → approve → apply. The inspector's Managed row names the folder. |
| UM — a hollow, muted pill | Discovered by sync only: Cushy sees it in the cloud, but no Terraform state describes it. | Adopt it from Inventory → ⚙ Add to folder (or the Import screen) to bring it under management. Editing is refused until then. |
The pair is deliberately readable without colour: the managed mark is a filled rectangle in bold, the unmanaged mark is a hollow pill in a lighter weight, so they differ by silhouette and fill as well as by letterform. Management is never encoded in a status colour — health (● ▲ ■ ◇) and lifecycle (◌ draft, ✕ deploy failed) keep their own scale, and the dashed outline still means "planned", never "unmanaged".
To audit a large estate at a glance, use Highlight unmanaged in the map toolbar: it fades every Terraform-managed node so the unmanaged ones stand out. Like drag positions and box sizes it is a view-only toggle — nothing is persisted, and it resets when you leave the screen.
The status scale
Status is never colour alone. It always pairs a colour with a glyph and text, so it is readable for colour-blind operators and in any theme:
| Glyph | Status | Meaning |
|---|---|---|
| ● ok | Healthy | Operating normally. |
| ▲ warn | Warning | Degraded or anomalous; needs attention. |
| ■ crit | Critical | Failing; likely impacting. |
| ◇ unknown | Unknown | Not enough signal, or read-only. |
| ◌ draft | Planned | A Terraform plan exists; nothing was created in the cloud yet. |
| ✕ deploy failed | Failed | An apply failed; nothing exists in the cloud. Fix the variables and re-apply. |
Map and table parity
Every map interaction is also available as a table — segment health and inventory both have a table view — so the topology is fully usable with a keyboard and a screen reader, not only by pointing at the map.
Structural graph vs. traffic overlay
The dependency graph (VPCs, subnets, gateways, endpoints, route tables, transit-gateway attachments and how they connect) is discovered from real AWS APIs — DescribeInternetGateways, DescribeNatGateways, DescribeVpcEndpoints, DescribeRouteTables and DescribeTransitGatewayAttachments — for every connected AWS account, so you see the full plumbing *with and without* traffic. Every plumbing node is also listed in Inventory and can be imported into Terraform (a route table becomes aws_route_table, an internet gateway aws_internet_gateway, and so on).
The traffic overlay weights the edges by real byte/packet volume. It requires VPC Flow Logs to be enabled on the VPC. Cushy detects whether flow logs are configured; when they are not (or byte aggregation is not yet turned on for the connection) the map honestly shows the dependency graph without traffic and a note saying so — it never fabricates volume.
Status today
The structural dependency graph (VPCs/subnets/IGW/NAT/endpoints/route-tables/TGW attachments + their edges, incl. route-table→subnet association lines with implicit main-table coverage), resizable container boxes, the traffic overlay, per-node/per-edge hover details, pan/zoom, segments, the per-node TF / UM management marker with its Highlight unmanaged toolbar toggle, and status theming are shipped. Route-table→subnet association fidelity is AWS today; Azure/Alibaba still draw a single route-table→VNet/VPC association edge. Traffic requires VPC Flow Logs; real flow-log byte ingestion on live AWS is the next step (the data model and UI are complete). The reachability / path-analysis engine is now shipped and is driven FROM the map — click a node, then *Test reachability* in the inspector; see Network reachability; drag-to-connect persistence remains on the roadmap — see Preview & roadmap features.